Debug Test Runs
Master comprehensive debugging tools for E2E testing. When tests fail, you need powerful debugging capabilities to quickly identify the root cause and resolve issues efficiently.
How It Works
Desplega.ai provides comprehensive debugging capabilities that let you inspect every aspect of your test runs - from browser state and network requests to console logs and performance metrics. This guide shows you how to leverage these tools for efficient troubleshooting.
Debugging Tools
Visual Debugging
Watch test recordings and inspect browser state in real-time to understand exactly what happened during test execution.
Network Analysis
Analyze network requests, response times, and API calls to identify performance bottlenecks and integration issues.
Log Monitoring
Monitor console logs, errors, and warnings with advanced filtering and search capabilities for quick issue identification.
1. Inspect Browser State
The State tab provides comprehensive visibility into your browser's internal state during test execution. This is invaluable for debugging issues related to authentication, data persistence, and application state.
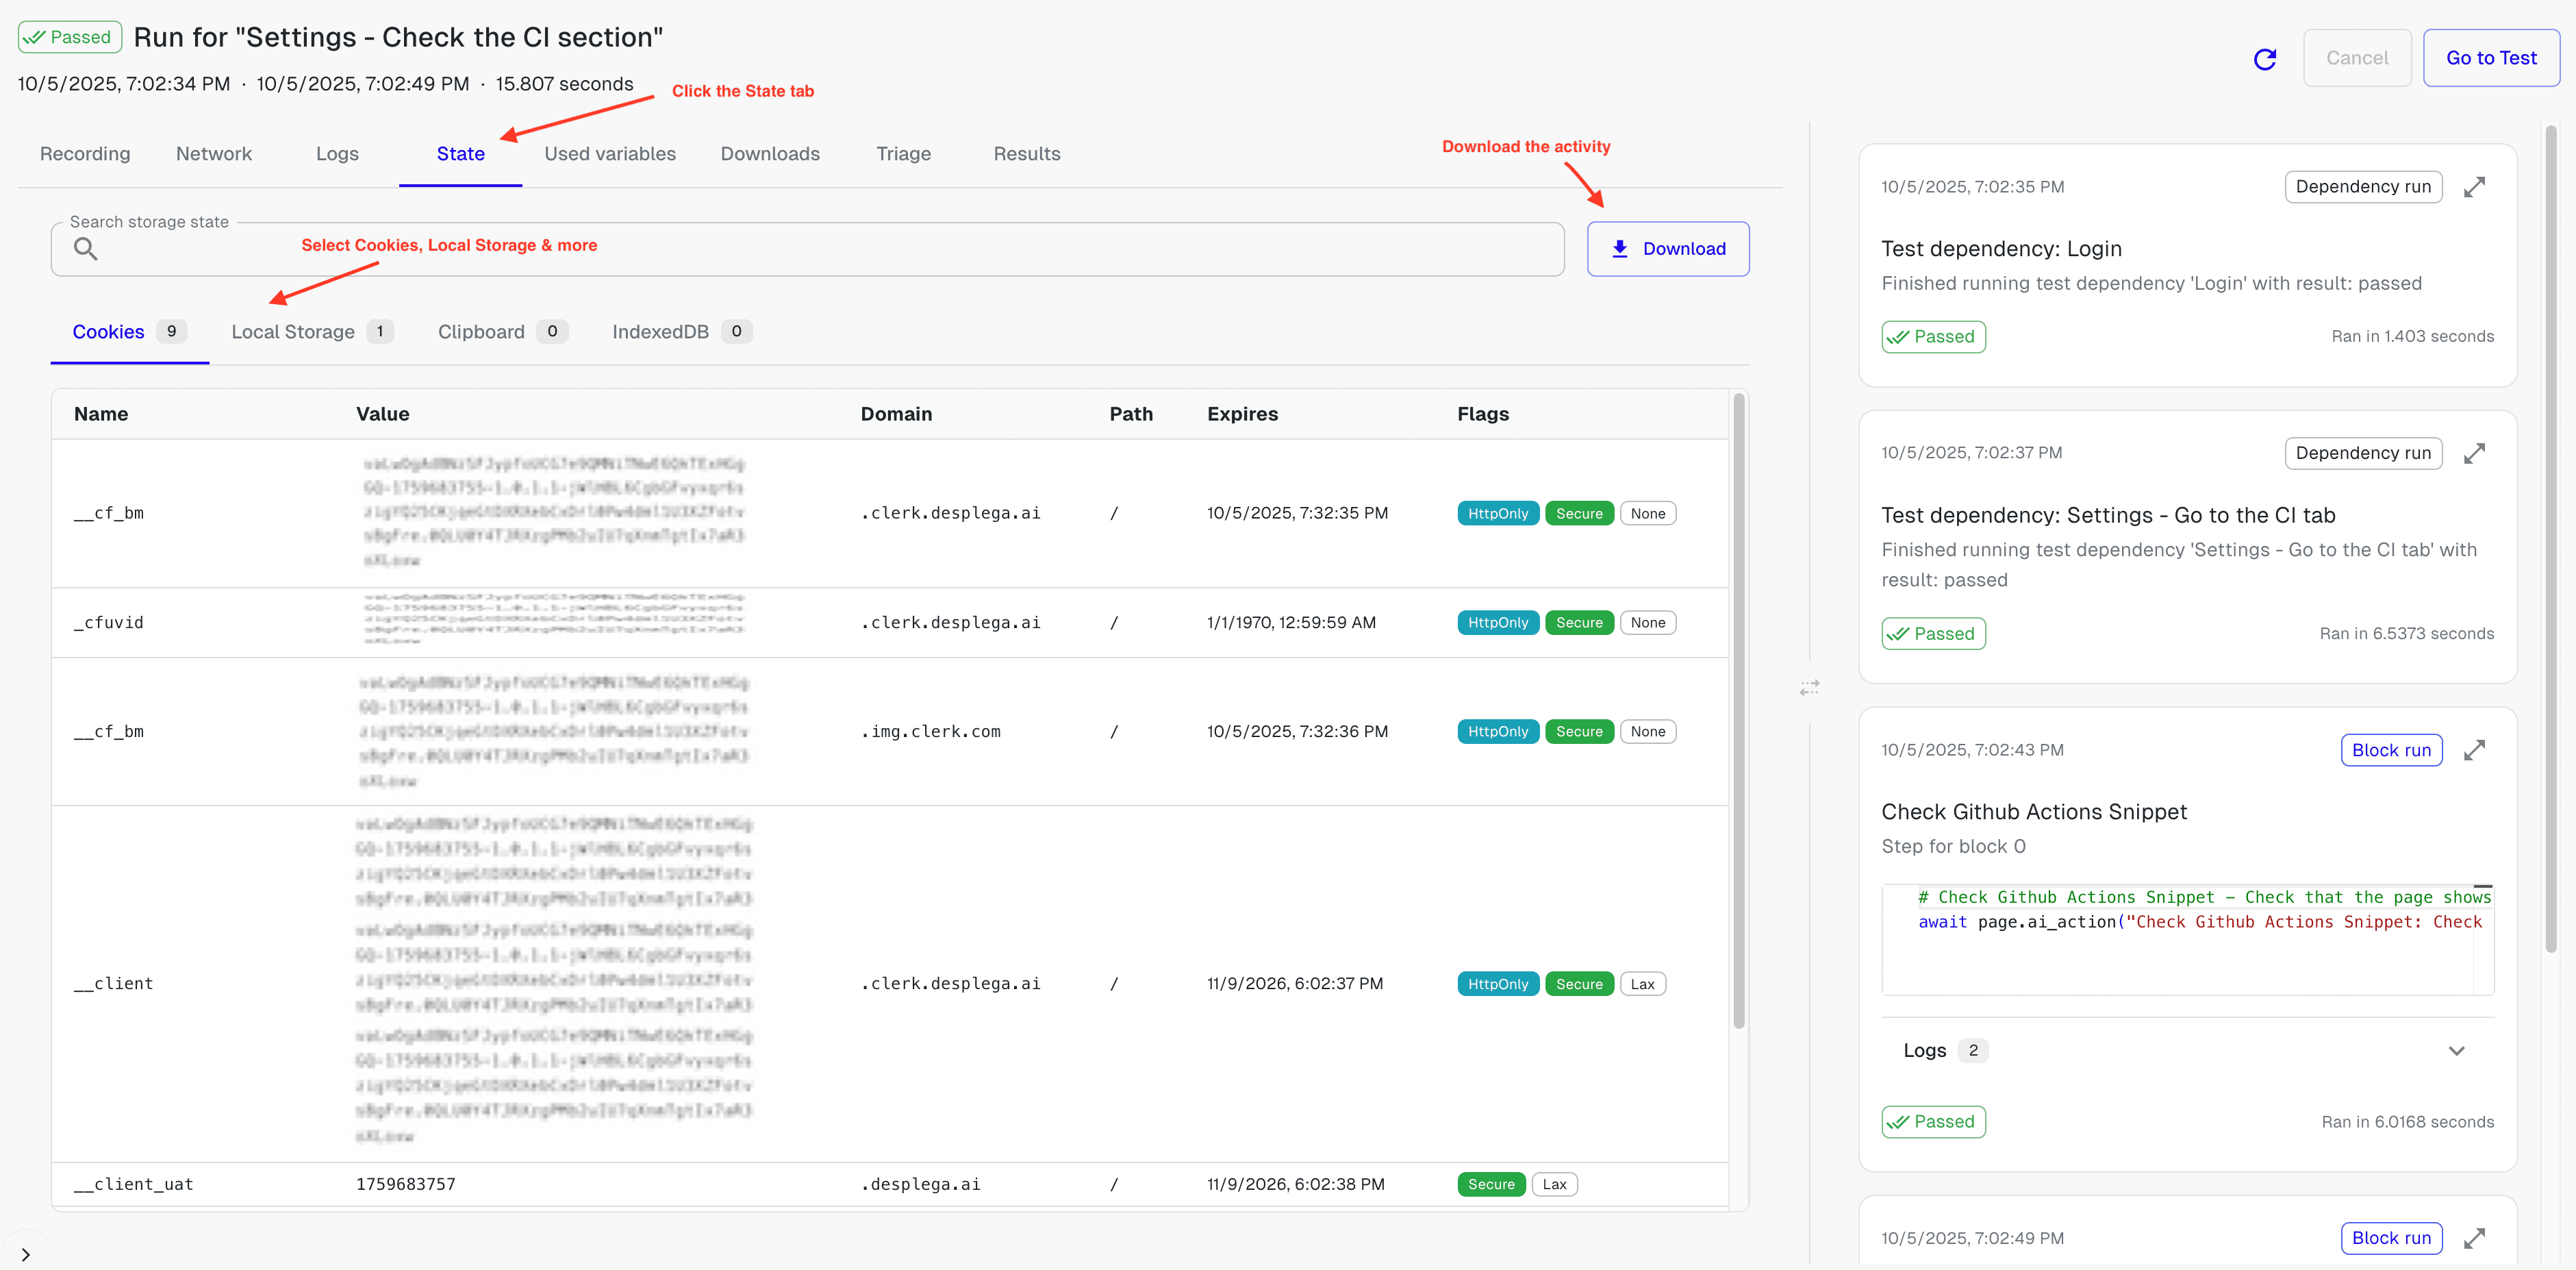
Storage Inspection
- Cookies: View all cookies with their values, domains, paths, and expiration dates
- Local Storage: Inspect stored data and application state persisted locally
- IndexedDB: Examine complex data structures and client-side databases
- Clipboard: Check clipboard contents for copy/paste functionality testing
Search & Filter
- Search Storage State: Quickly find specific values or keys across all storage types
- Filter by Type: Focus on specific storage mechanisms with tab-based filtering
- Download Data: Export browser state for offline analysis and debugging
2. Analyze Network Requests
The Network tab gives you complete visibility into all HTTP requests made during your test. This is essential for debugging API issues, performance problems, and integration failures.
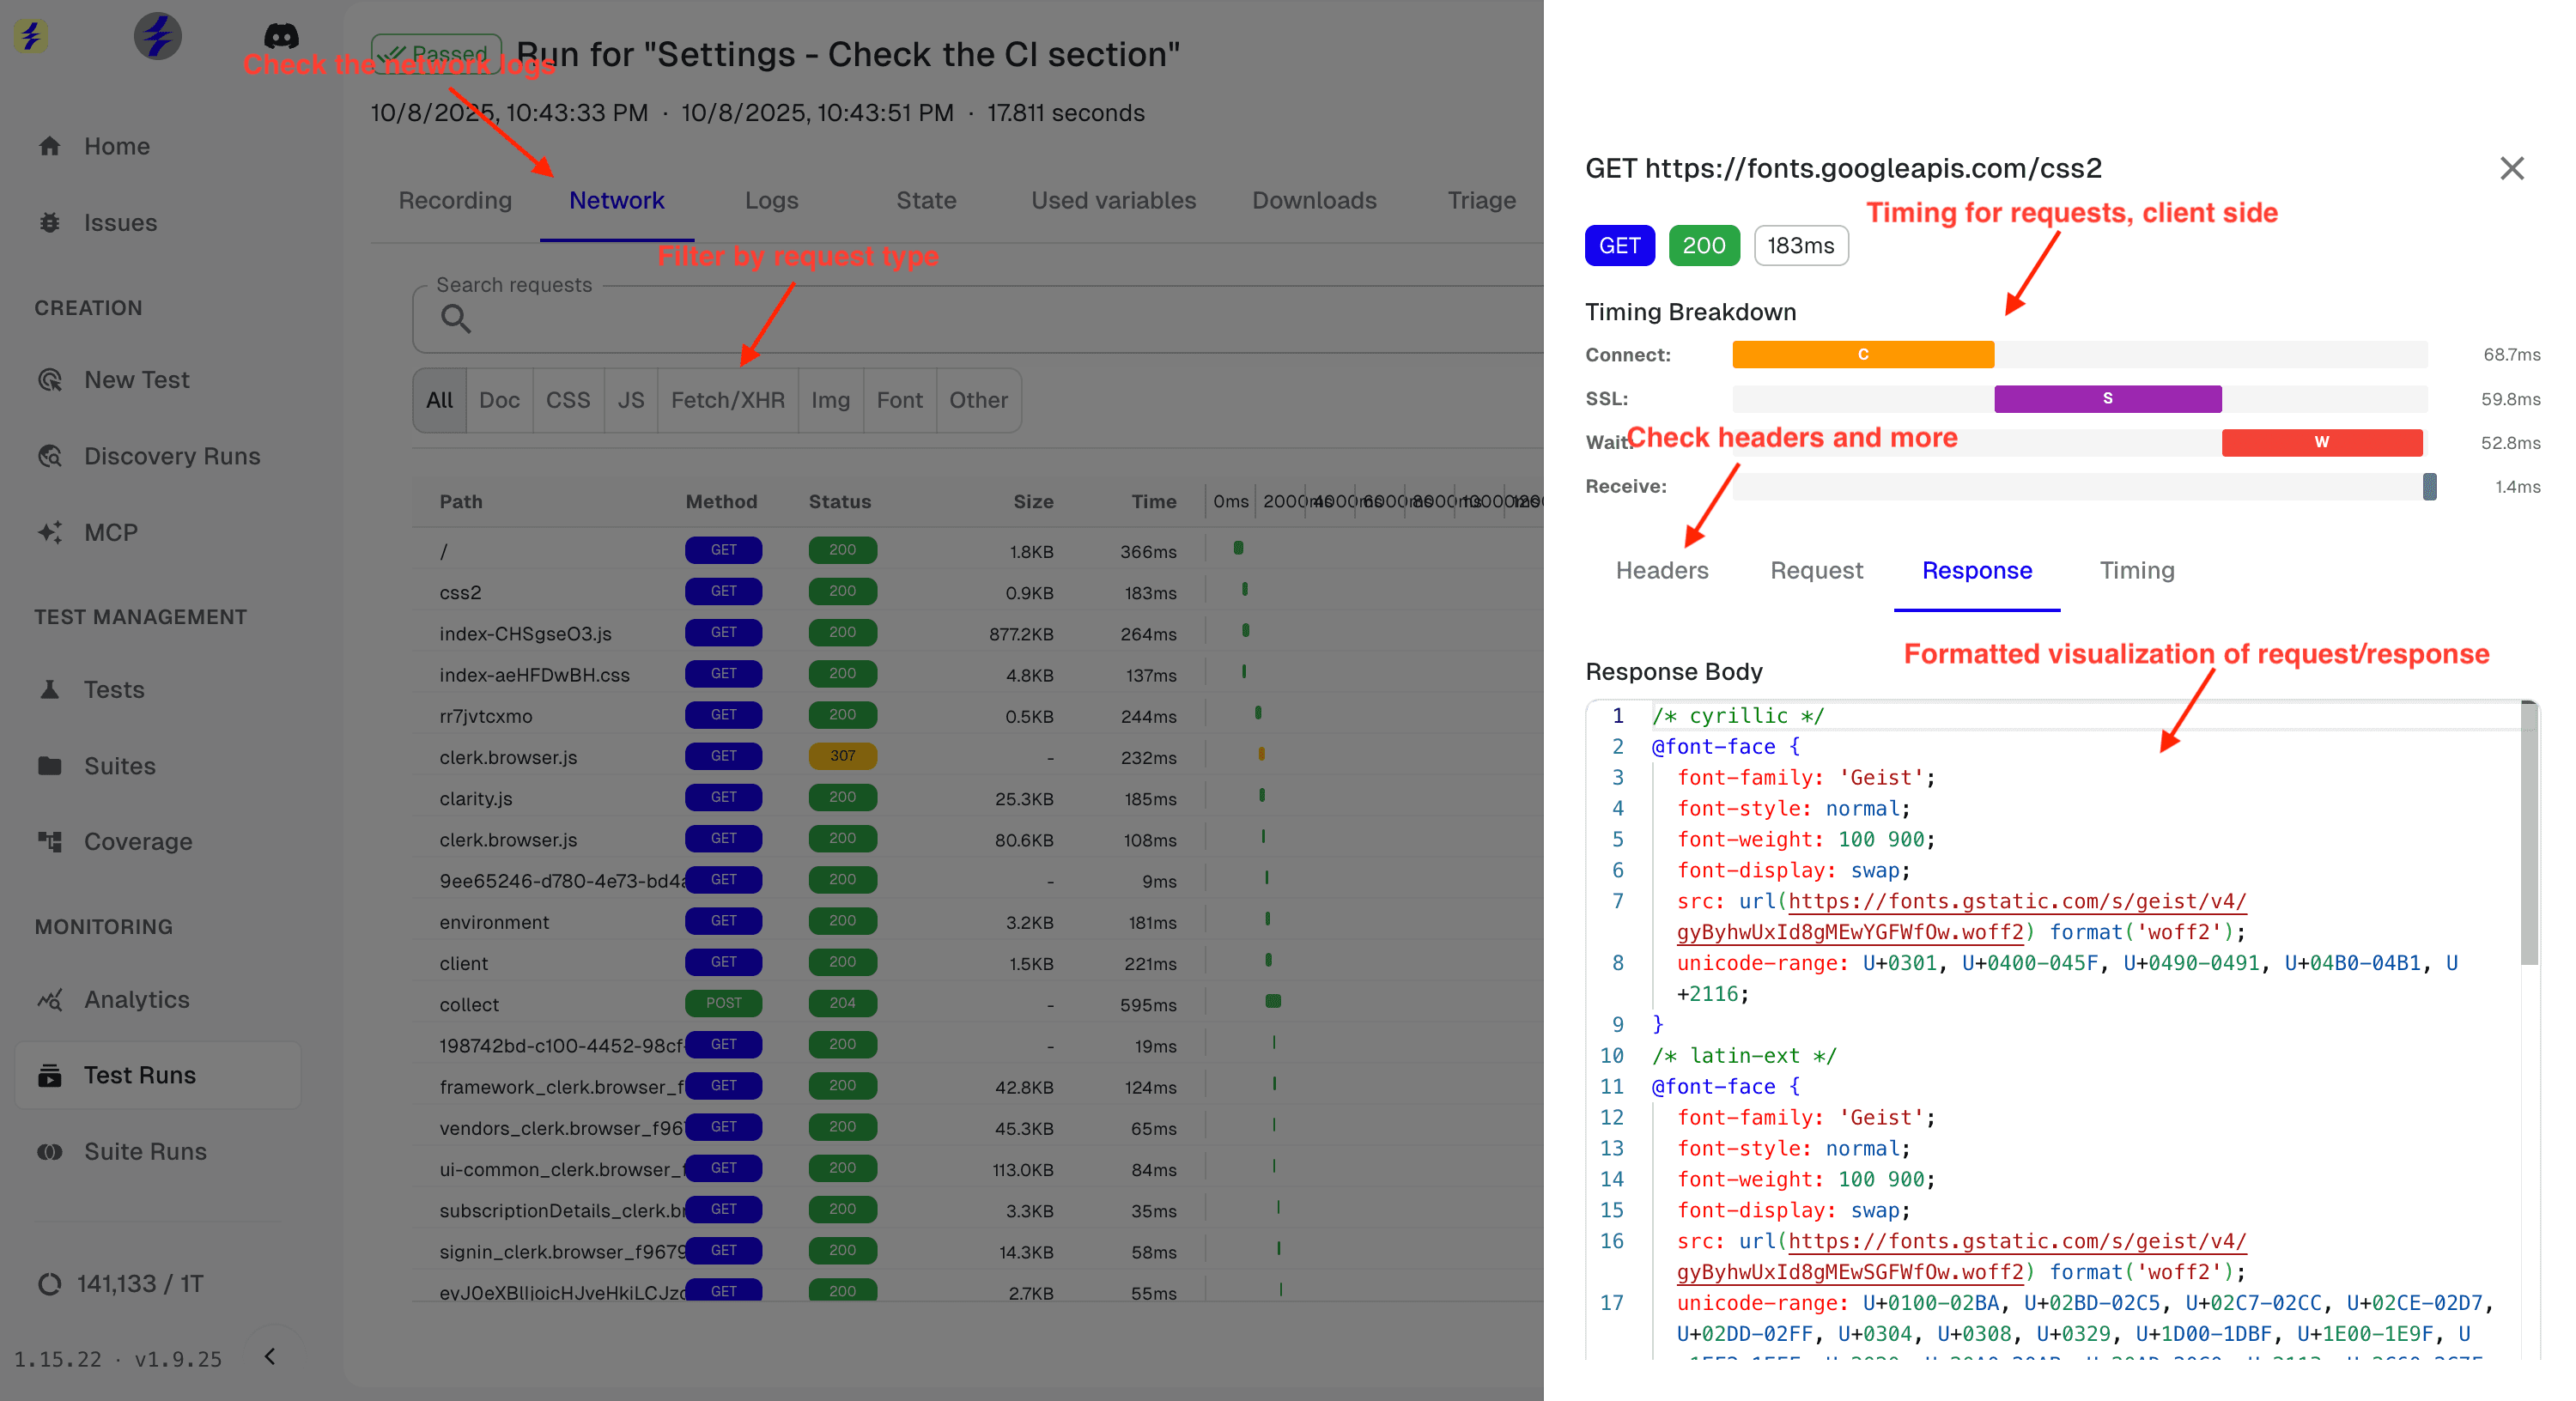
Request Filtering
- Filter by Type: Focus on specific request types: Doc, CSS, JS, Fetch/XHR, Images, Fonts
- Search Requests: Find specific URLs or patterns across all network activity
- Status Filtering: Quickly identify failed requests and error responses
Performance Analysis
- Timing Breakdown: Analyze Connect, SSL, Wait, and Receive phases for each request
- Request Details: Inspect headers, request body, and response content
- Visual Timeline: See request timing in a visual bar chart for easy comparison
3. Monitor Console Logs
The Logs tab captures all console output during test execution, including errors, warnings, and debug messages. This is your first line of defense when identifying JavaScript errors and application issues.
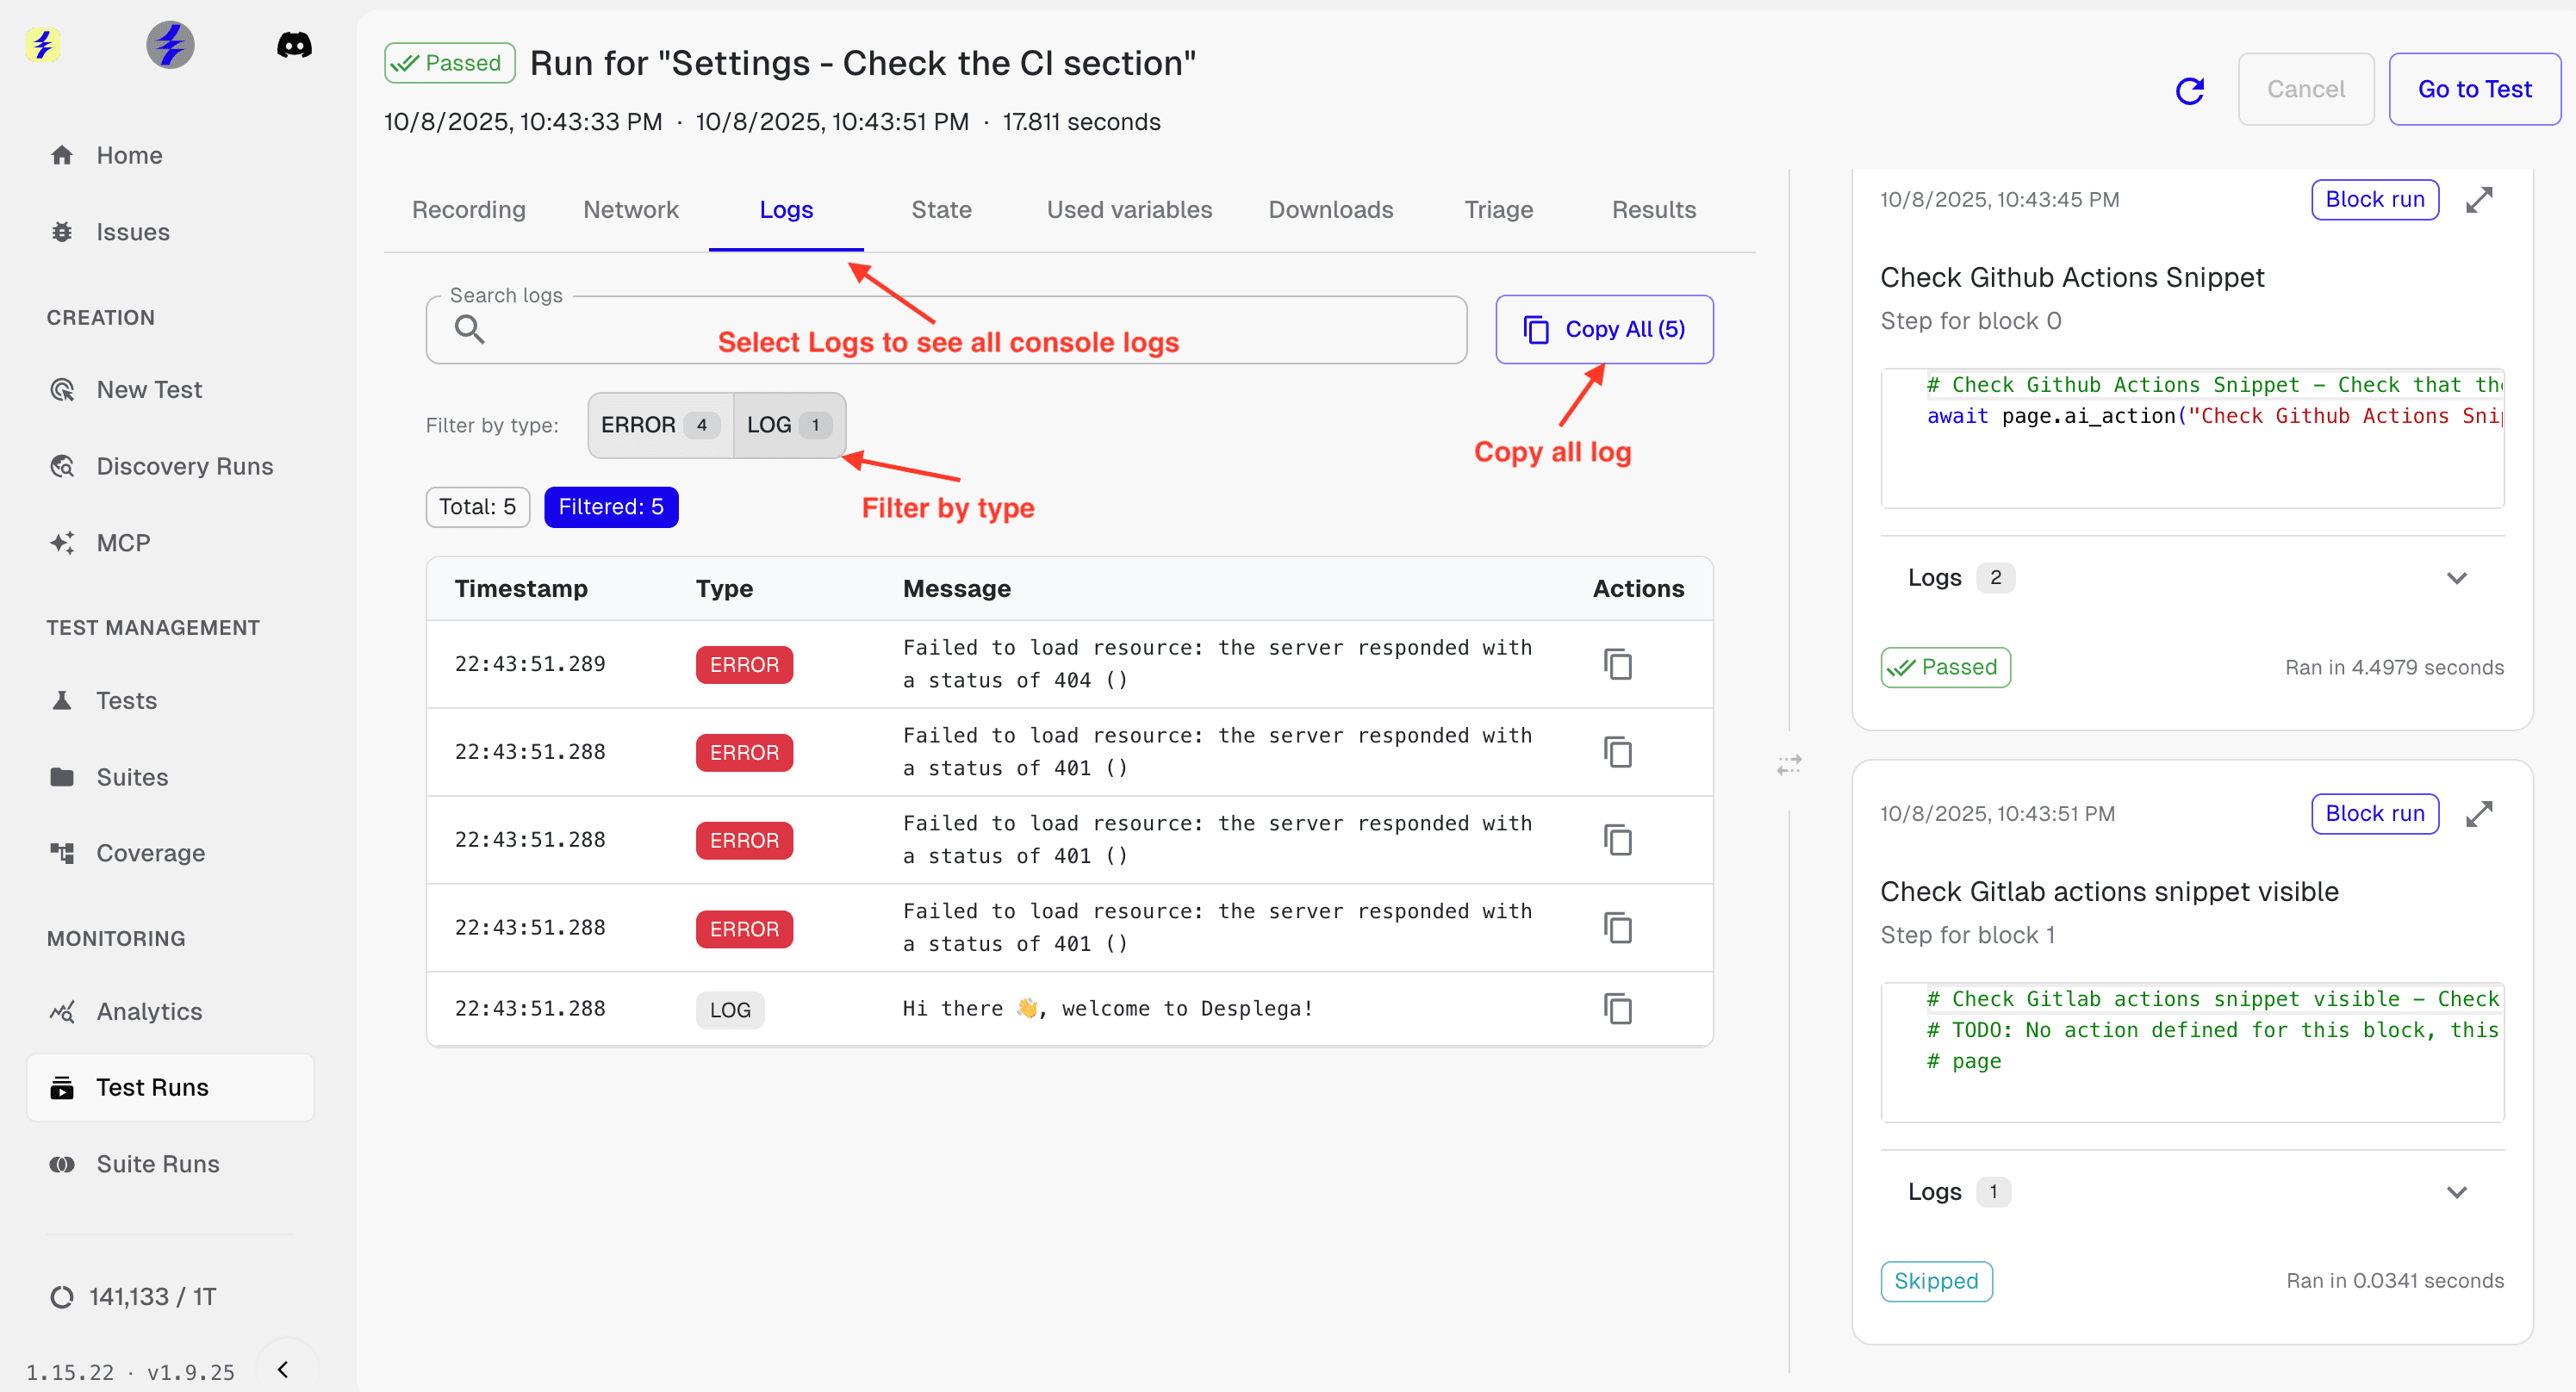
Log Management
- Filter by Type: Separate errors from general logs for focused debugging
- Search Logs: Find specific error messages or patterns across all log entries
- Copy All Logs: Export all logs for sharing with team members or external tools
Error Tracking
- Error Counts: See at-a-glance how many errors occurred during test execution
- Timestamped Logs: Track when errors occurred relative to test steps
- Individual Copy: Copy specific log entries for detailed analysis
Benefits
- Comprehensive Debugging: Inspect every aspect of your test runs with powerful debugging tools.
- Faster Issue Resolution: Quickly identify and resolve test failures with visual debugging tools.
- Better Test Quality: Understand exactly what happened during test execution to improve test reliability.
Common Debugging Scenarios
Authentication Issues
- Check cookies and authentication tokens in the State tab
- Look for 401/403 responses in the Network tab
Performance Problems
- Identify bottlenecks using Network timing breakdown
- Check for failed CSS/JS loads causing rendering issues
Data Issues
- Verify stored data integrity in the State tab
- Check response content and status codes in Network tab
JavaScript Errors
- Filter logs by error type to focus on JavaScript issues
- Use detailed error messages to trace problem sources